Sigraweb · Product design case study

SigraAI Helpdesk

SigrAI Helpdesk connects two audiences with contrasting needs: customers who want to open a ticket quickly and understand what is happening, and the support team (CS), who need to triage, track and resolve requests with as little friction as possible.

All projects
Company
Sigraweb
My role
End-to-end design
Scope
5 redesigned screens
Research
Moderated usability tests
Dashboard: the visual answer in 5 seconds
Summary

The original interface mixed AI steps, statuses and pending actions with no clear hierarchy. This created doubt (“is anyone handling this?”), rework and information loss between the AI and CS.

I redesigned the end-to-end flow (dashboard, list, ticket creation, detail and reports) around three principles: simplicity, breathing room and information hierarchy. I validated the problems through usability tests with the internal team and turned each finding into a traceable design decision.

In numbers

  • 7usability findings gathered in tests with CS and Sales
  • 5 of 6unique problems already solved in the final screens (83%); the 6th is prioritised as the next step
  • 1single required field when opening a ticket (the title)
  • 4dashboard indicators, with 1 primary action per screen: “New ticket”
  • 5redesigned screens connected by one visual system

Context and problem

A helpdesk exists for a simple promise: “you asked for help, and someone will solve it”. To keep that promise, the interface must answer three questions in seconds:

  • What is happening with my ticket? (status)
  • What depends on me? (next action)
  • Who has it? (assignee)

In the previous version, none of these answers was obvious. The AI triaged tickets, but users could not tell whether a step had failed, was waiting for them, or whether the team had already taken over.

Project goalMake the helpdesk simpler, more direct and organised, reducing customer uncertainty and CS effort.

My role

End-to-end design: user research, problem analysis, principle definition, interface (UI) and visual system design, and traceability between research and decisions.

  • Research focused on the current interface, mapping flows to identify issues and raise hypotheses.
  • Clean interfaces aligned with the system’s standards.
  • Documentation of every process and of changes to potential components.

Research: what users showed us

Method: moderated usability tests with 3 people from the internal team, representing both sides of the operation.

  • Ana GabrielliCS · handles and resolves
  • Alisson SantiagoSales · follows up with customers
  • Gabriel EliasDeveloper · works on tickets

About the sample size. Three participants don’t provide statistical significance, and that wasn’t the goal. In qualitative testing, classic usability studies show that a few users already reveal most severe interface problems. So I treated the findings as high-confidence hypotheses to fix now and planned a new round to measure the effect.

I consolidated the 7 findings into 6 unique problems, because two of them described the same issue (clarity of steps and status).

#Problem foundWhy it matters
1The “Waiting for customer reply” step doesn’t make clear the action is the user’sDelays support: nobody acts because nobody knows they need to
2AI steps (“Searching previous tickets”, “Checking the knowledge base”) appear in redError colour makes users think the system failed
3The ticket number changes when it moves from the AI to the teamBreaks trust and makes the ticket hard to find
4The reply field stays active after the AI failsUsers think they are talking to whoever will solve it, and messages get lost
5CS can’t see the AI conversation; the Kanban is slow to update; there is no customer feedbackLost context, poor follow-up, no way to measure quality
6Reviewing the next ticket requires going back to the KanbanExtra steps repeated all day long
7Closed tickets disappear and can’t be searched by number or nameLooks like a bug and prevents retrieving information
8Assignee and module columns have little visual differentiationHard to tell what is filled in from what is pending

Design principles

The findings pointed to the same core: too much noise and no hierarchy. I defined four principles to guide every decision.

One primary action per screen

Each screen has a single highlighted button (solid purple), so users never have to guess the next step.

Colour with meaning

Red only for high priority; green for done; orange for in progress/medium. AI steps never use error colour.

State always explicit

Every ticket shows its status, assignee and what’s missing. “Unassigned” is a visible state, not a blank.

Breathing room as a tool

Generously padded cards, few type levels and grouping by proximity, so the eye finds what matters effortlessly.

The solution, screen by screen

Each screen starts from a problem raised in research, records the decisions made and the reasoning behind them.

Dashboard: the visual answer in 5 seconds

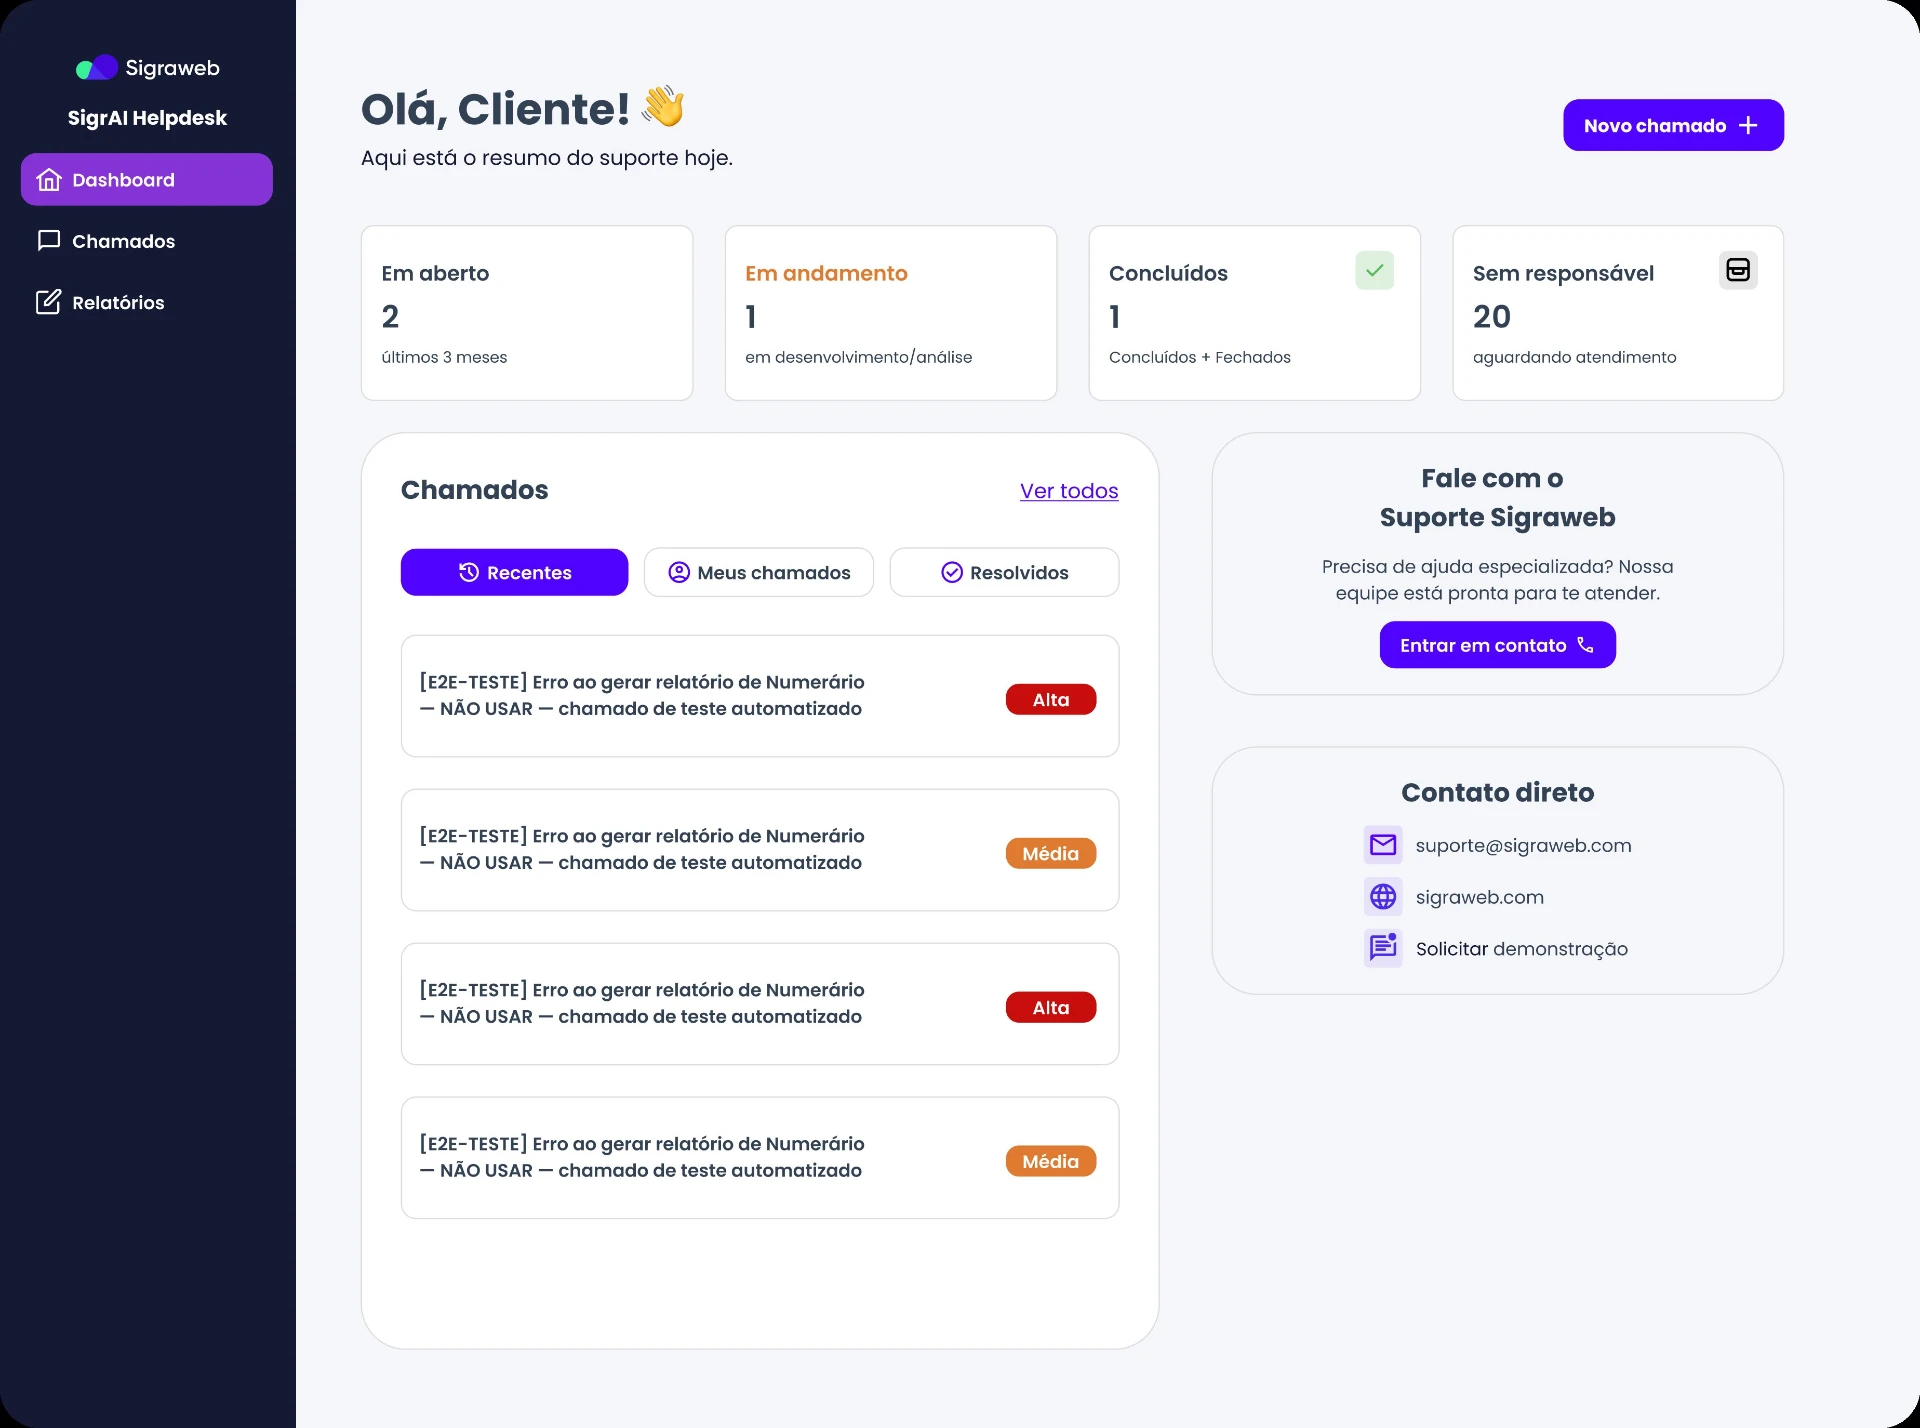
Dashboard: the visual answer in 5 seconds

Problem it solves

Users had to open the list and filter it to understand the overall situation.

Rationale

A clear hierarchy (number → label → caption) reduces the time to understand the state of operations and reinforces principle 1.

Decisions

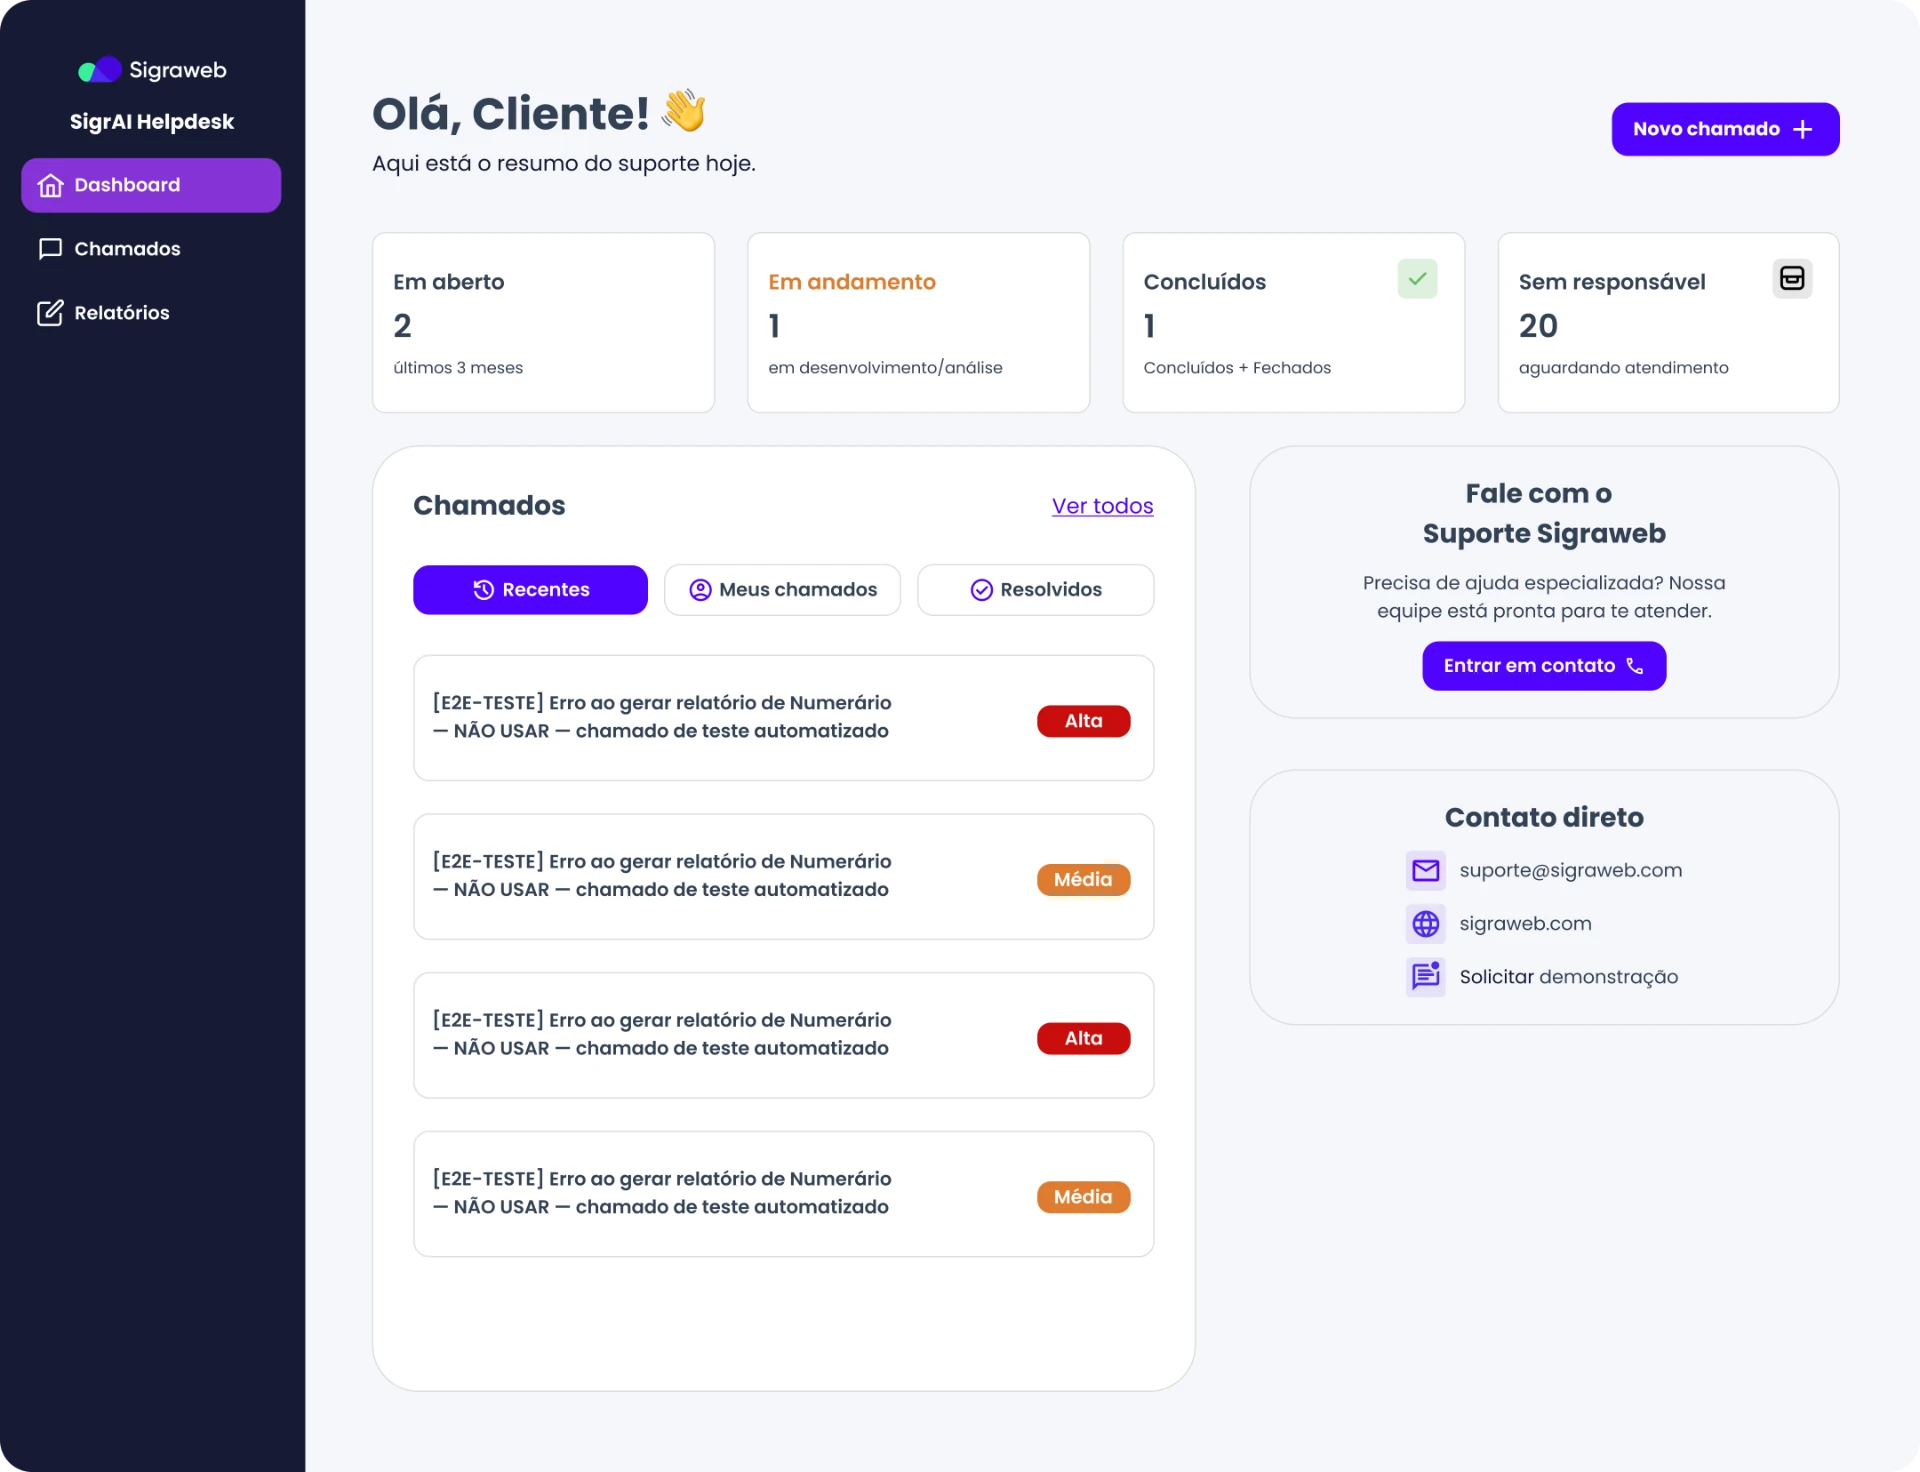
  • 4 indicator cards at the top (Open, In progress, Done, Unassigned), each with its own colour. The number is the strongest element; label and caption are smaller.
  • A personal greeting (“Hi, Customer!”) and daily summary, for a welcoming tone instead of a purely technical screen.
  • “Recent / My tickets / Resolved” tabs to switch views without leaving the screen.
  • A direct-contact sidebar with email, website and demo, for when a ticket isn’t the best route.
  • “New ticket” as the only primary button, always in the same place.
Ticket list: find any ticket, always

Ticket list: find any ticket, always

Problem it solves

Closed tickets disappeared and the list didn’t make the assignee clear (findings 7 and 8).

Rationale

Tables only work when users can scan them. Semantic colour, grey for pending items and visible filters turn the list into a decision tool.

Decisions

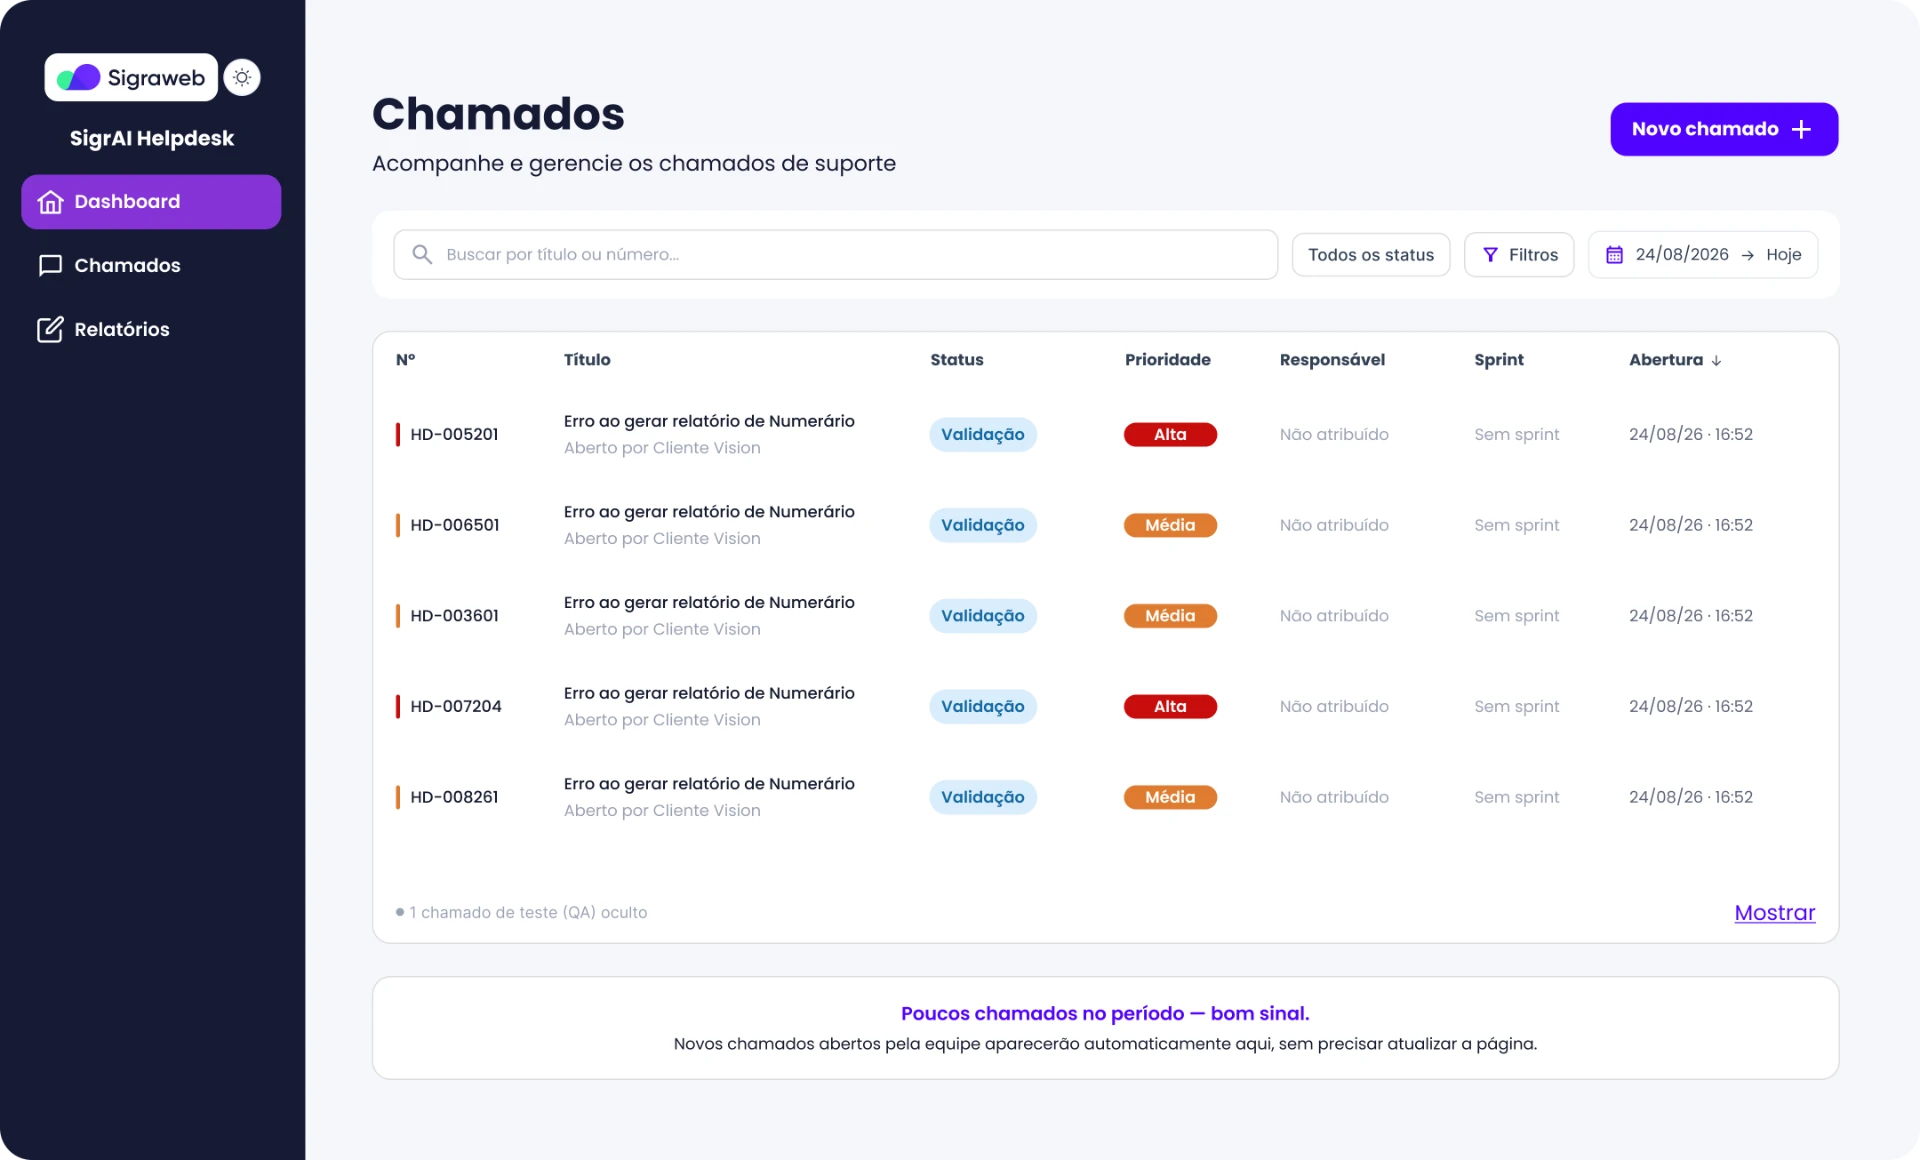
  • Prominent search by title or number, plus status filters, advanced filters and period in the same bar.
  • Columns ordered by reading priority: number, title, status, priority, assignee, sprint and opening date.
  • A coloured bar next to the number that signals priority before reading the text.
  • “Unassigned” and “No sprint” in light grey, separating pending from filled-in data.
  • Test (QA) tickets hidden by default, with a “Show” option, so they don’t clutter the real list.
  • A positive empty-state message (“Few tickets this period, good sign”) and a note that new tickets appear automatically without reloading, addressing complaints about slow updates.

New ticket: less effort, better quality

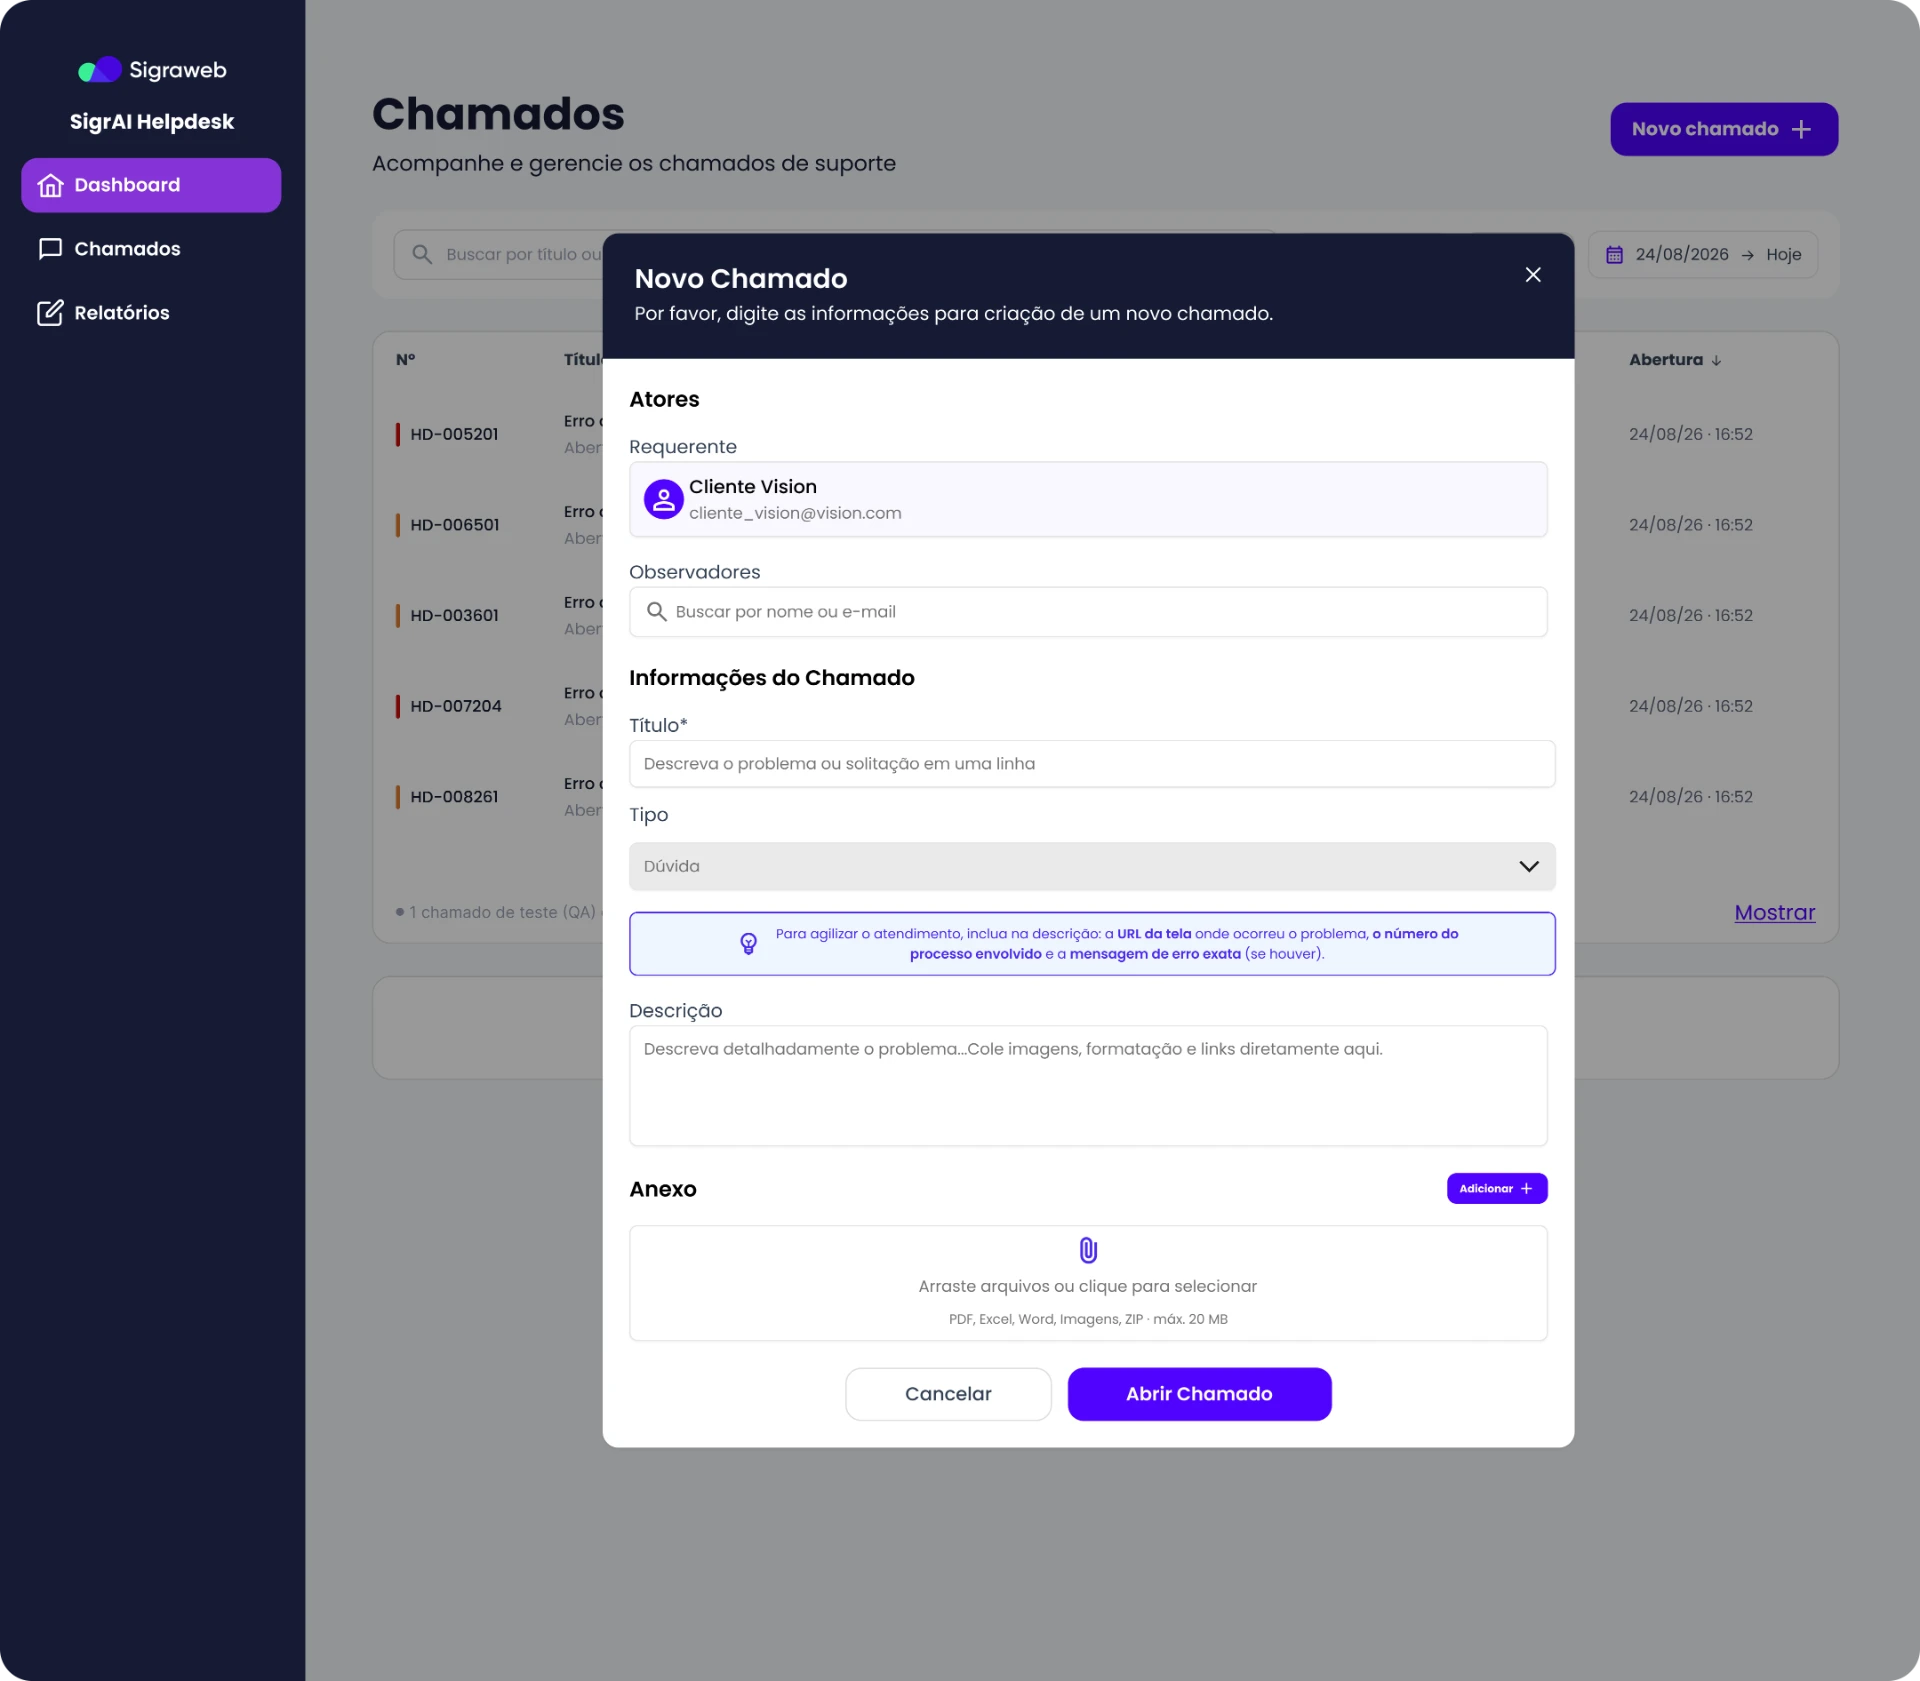
New ticket: less effort, better quality

Problem it solves

Tickets arrived without context, causing back-and-forth between customer and CS.

Rationale

Guiding at the entry point costs less than fixing later. Better descriptions mean fewer CS questions and faster resolution.

Decisions

  • Only 1 required field (title). The requester is prefilled, so users don’t type what the system already knows.
  • A form in blocks (People, Ticket information, Attachment) with section titles, so it feels short despite several fields.
  • A highlighted contextual tip asking for the screen URL, process number and exact error message — teaching users to open a good ticket without training.
  • The description accepts pasted images, formatting and links, reducing friction for people who usually only have a screenshot.
  • Drag-and-drop attachments with formats and the 20 MB limit stated before sending.
  • Primary (“Open ticket”) and secondary (“Cancel”) actions clearly differentiated.

Ticket detail: full context on one screen

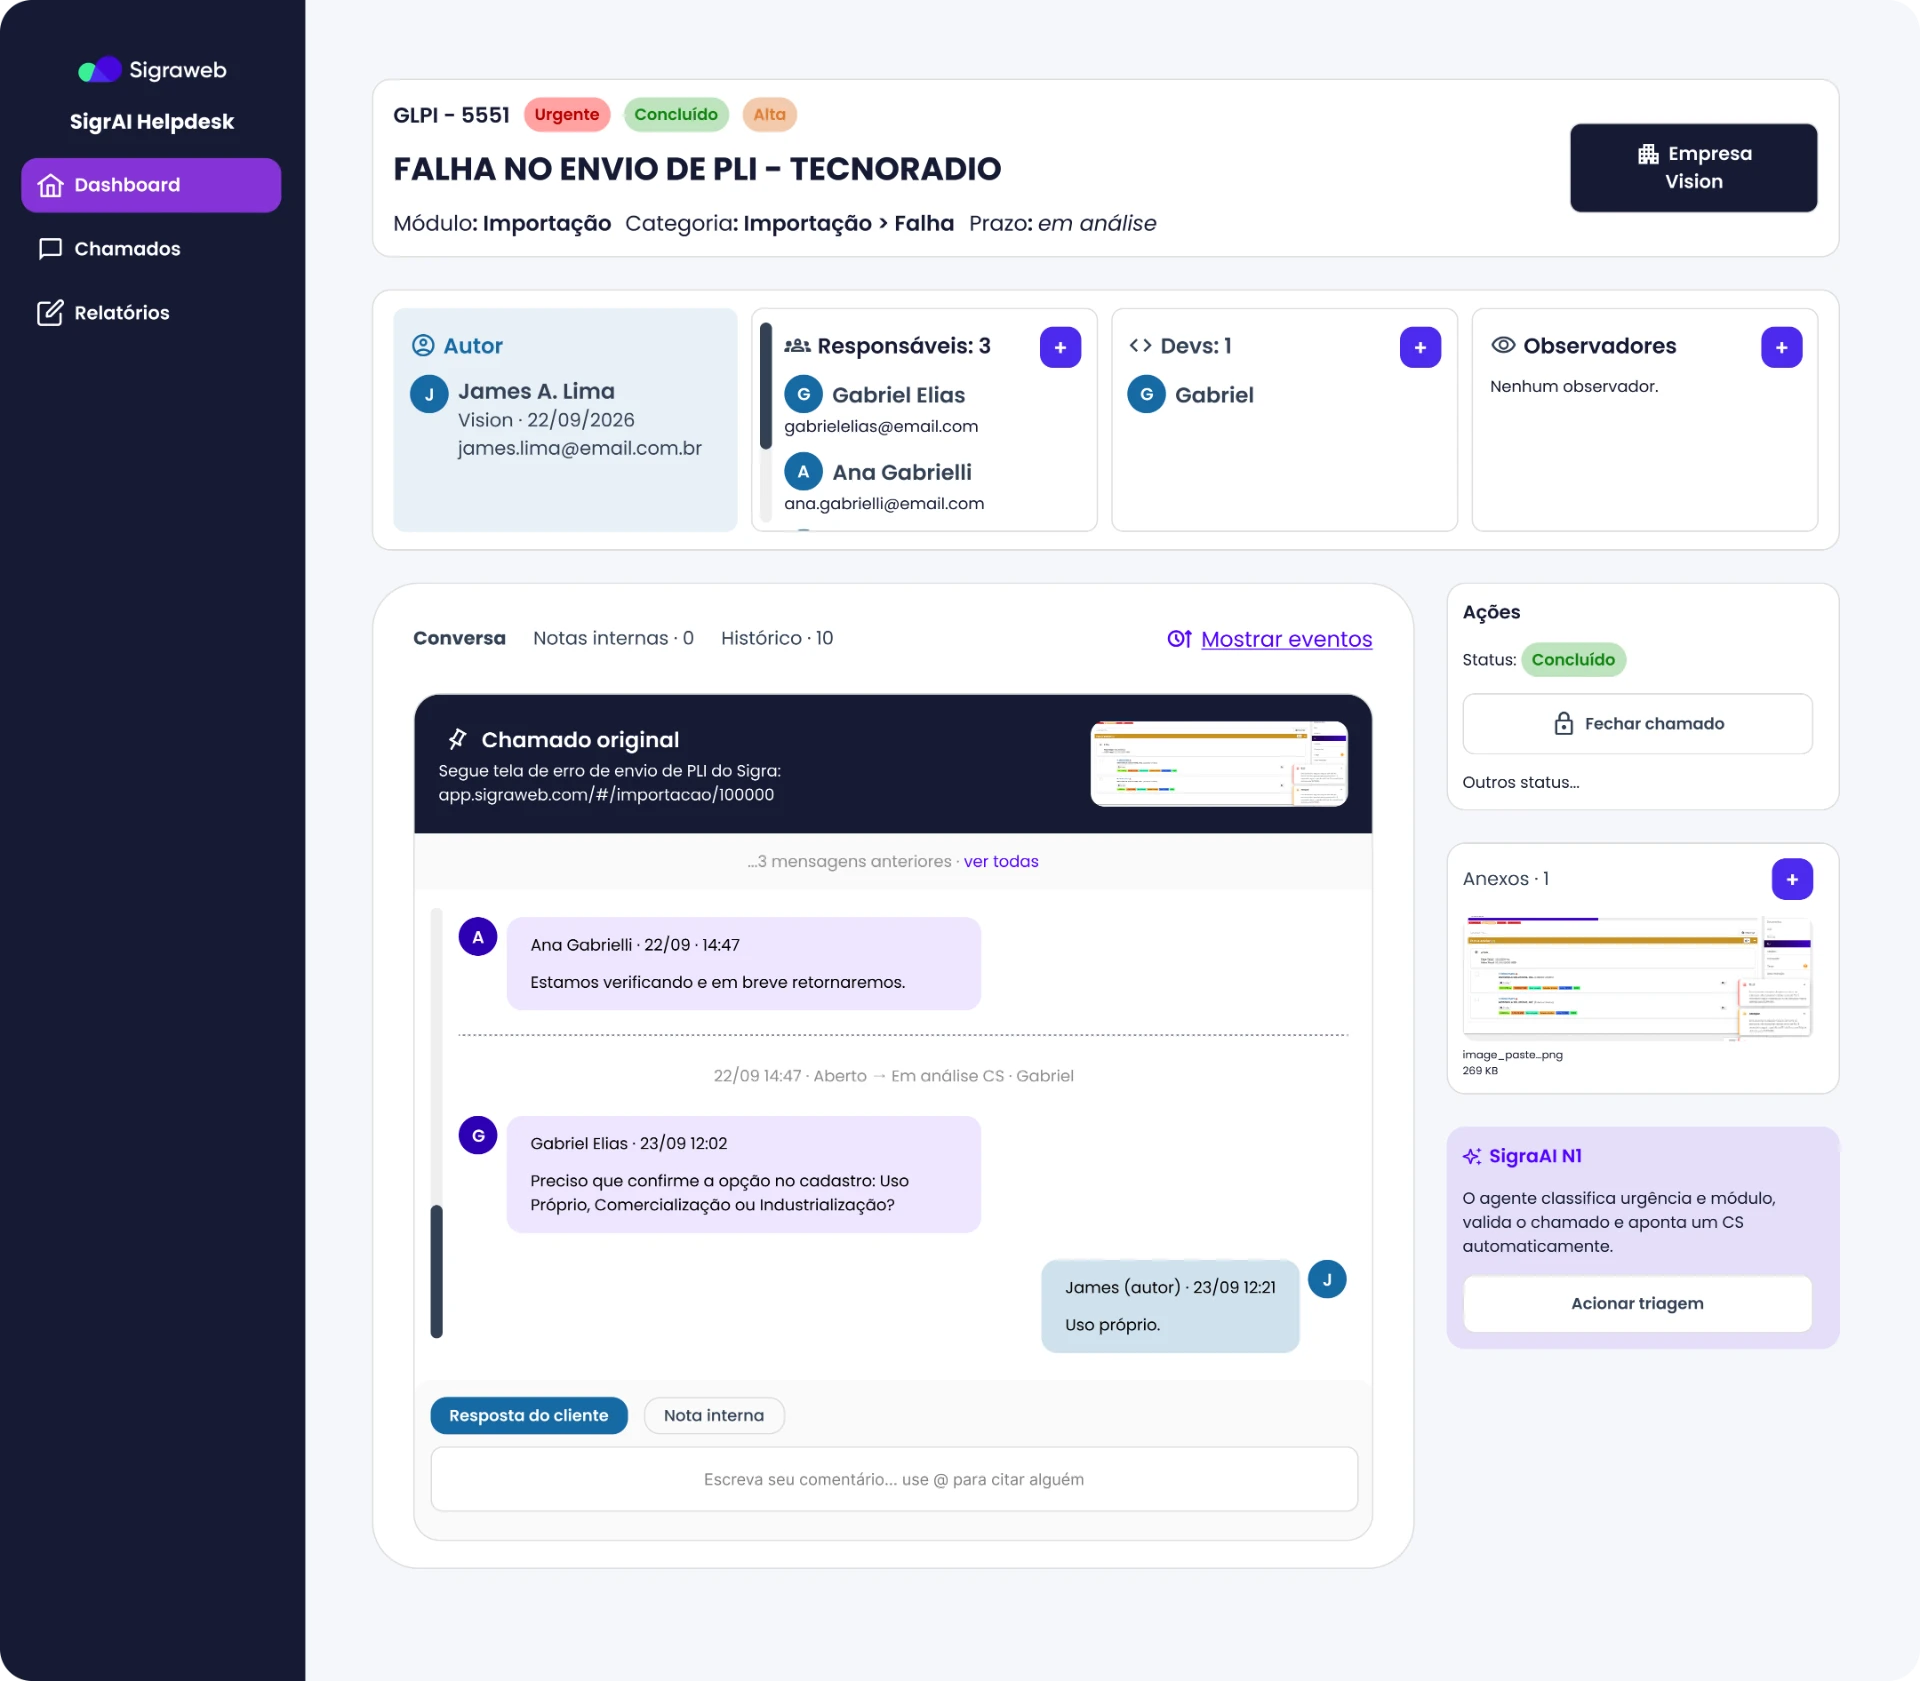
Ticket detail: full context on one screen

Problem it solves

Findings 1 to 5: confusing status, changing number, conversation split between AI and CS.

Rationale

Users open one screen and understand the whole story without rebuilding it. This directly tackles ignored messages and lost context between AI and humans.

Decisions

  • A header with a unique identity: number, title, module, category and deadline, with urgency, status and priority tags. The ticket number stays fixed.
  • Four people blocks (Author, Assignees, Devs, Watchers) with a “+” button: who is involved is visible without opening menus.
  • A unified conversation: the original ticket is pinned at the top, followed by a timeline of messages and status-change events (e.g. “Open → CS review”). AI and support history live in one place, accessible to CS.
  • A split between “Customer reply” and “Internal note” in the comment field, so users know who they are writing to and messages don’t get lost.
  • Conversation / Internal notes / History tabs with counters, to check without cluttering the conversation.
  • An actions panel with the current status highlighted, a “Close ticket” button and access to other statuses.
  • A SigraAI N1 card explaining what the agent does (classifies urgency and module, validates and assigns a CS) and letting users trigger triage. The AI stops being a black box and becomes a transparent role in the process.

Reports and KPIs: from loose data to decisions

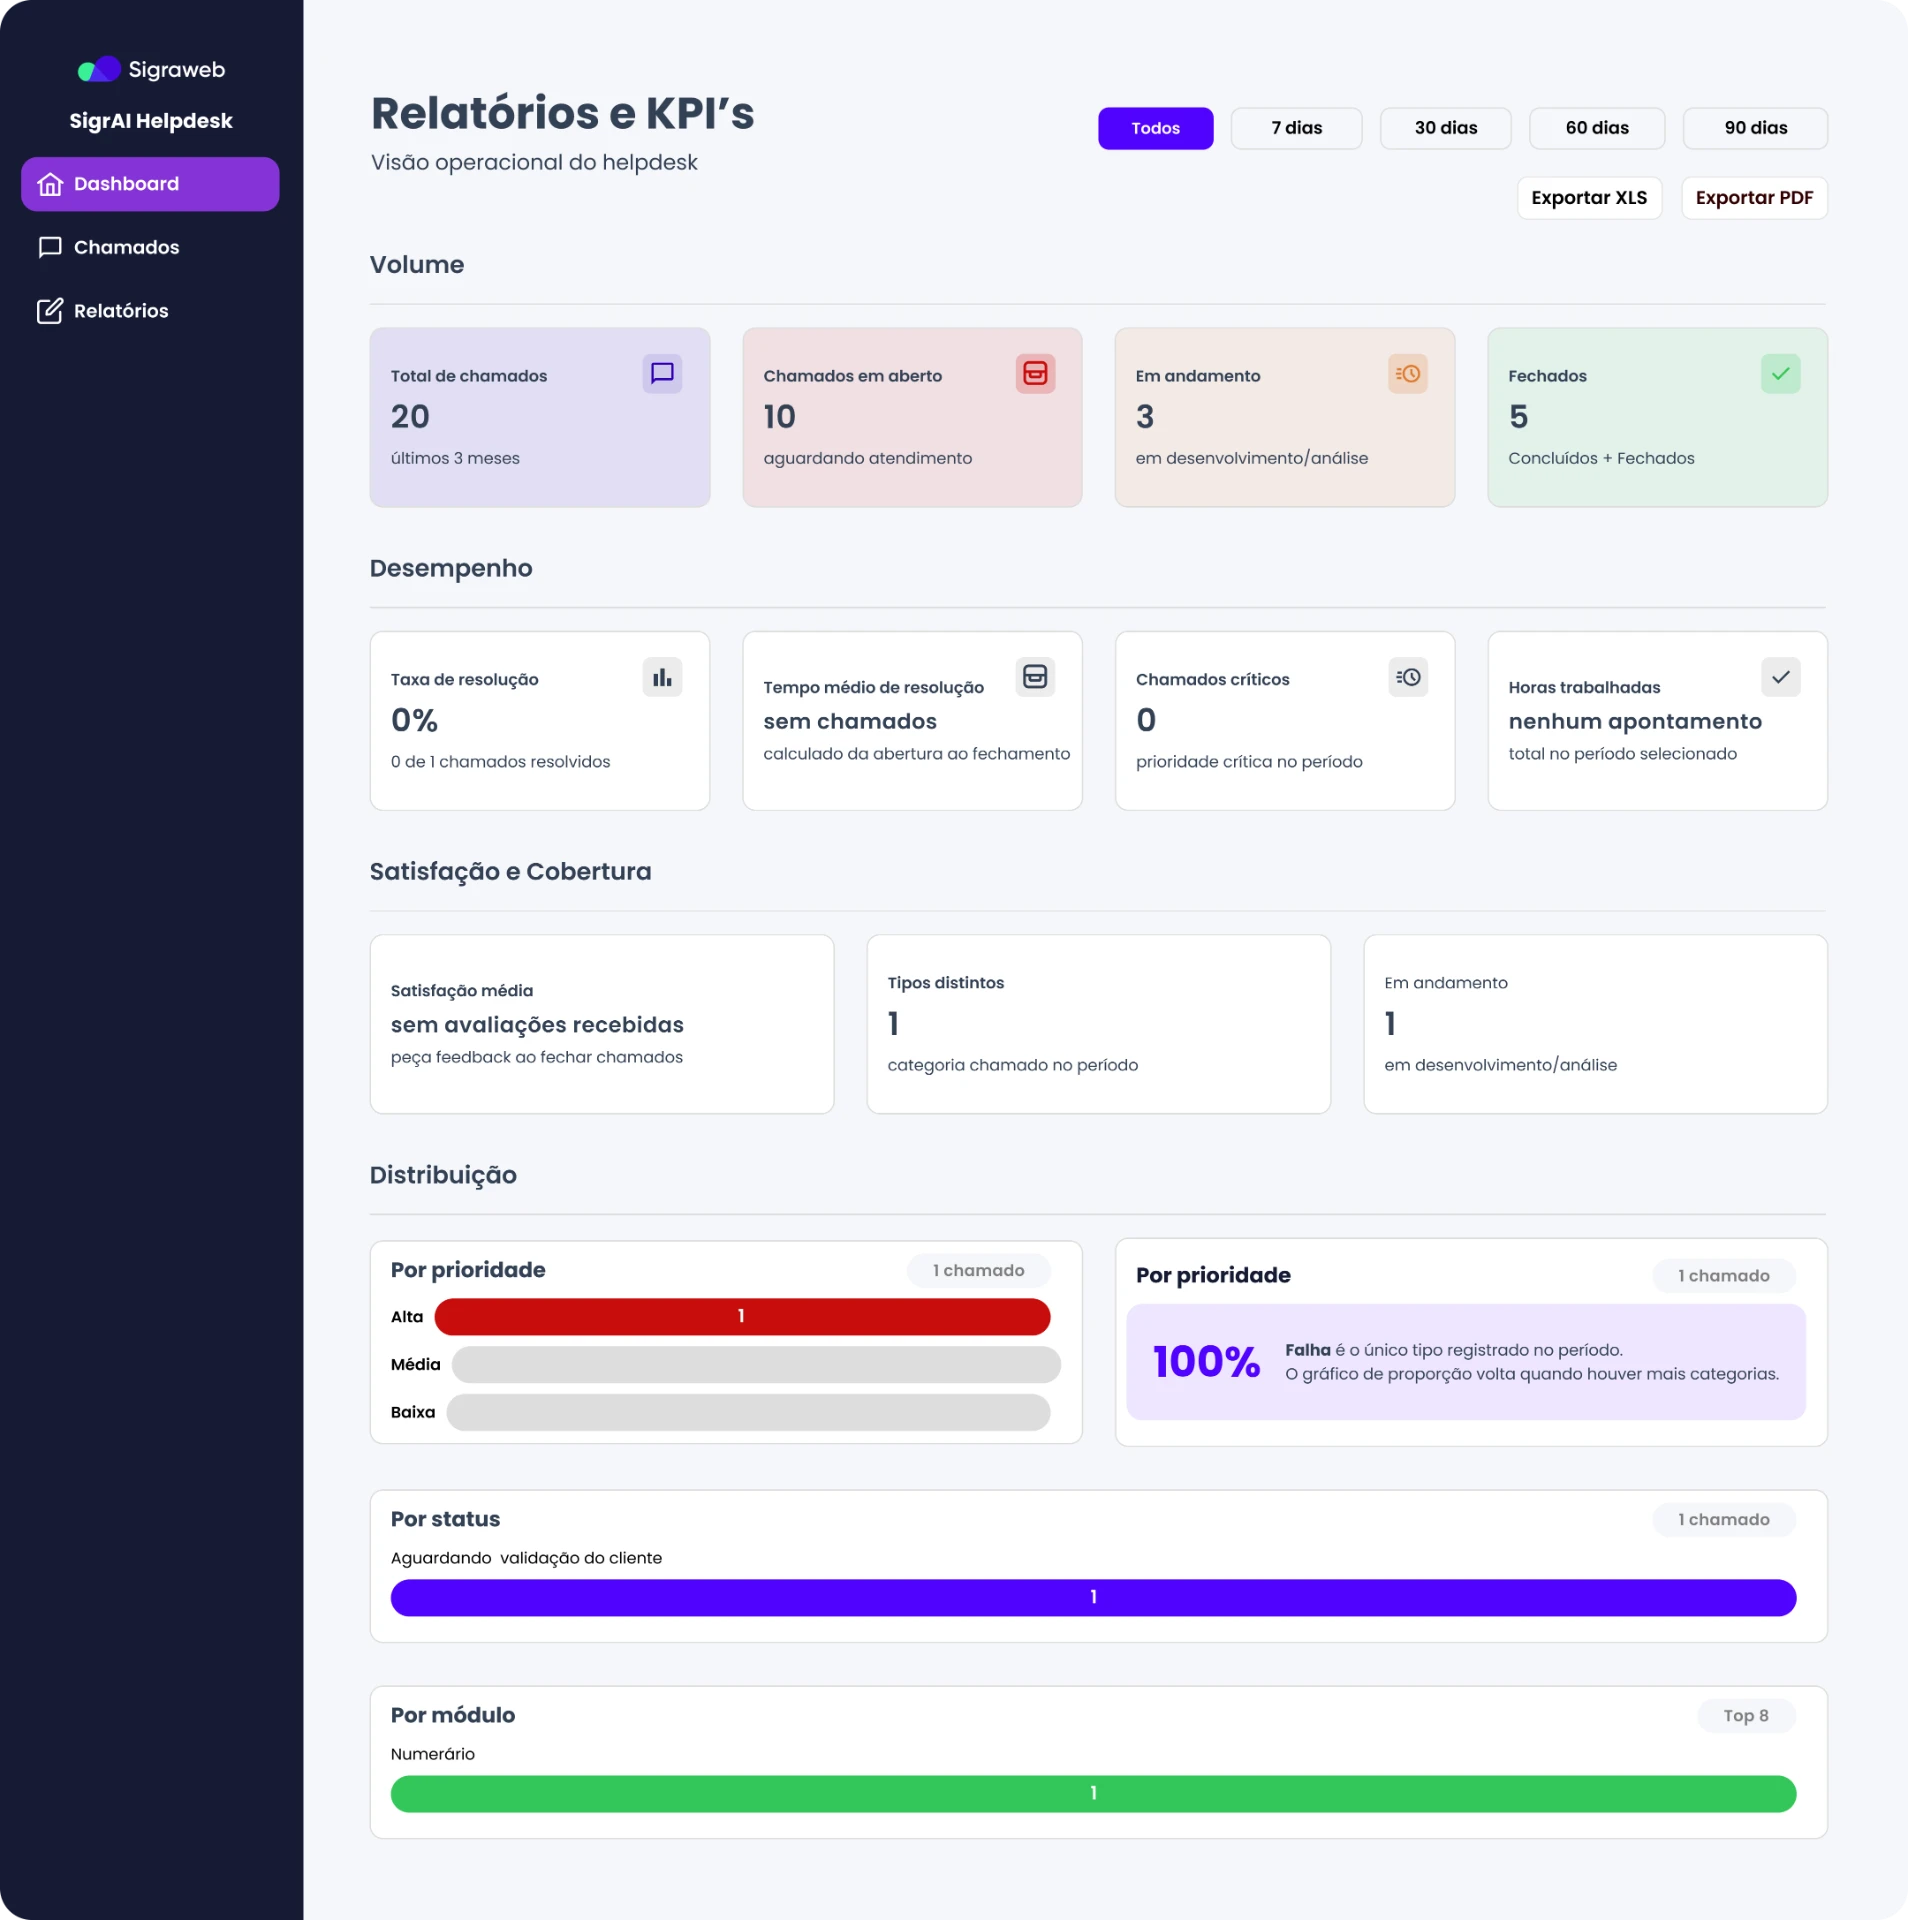
Reports and KPIs: from loose data to decisions

Problem it solves

There was no way to measure quality, volume or satisfaction (the missing-feedback finding).

Rationale

What isn’t measured doesn’t improve. The report gives the product a continuous improvement loop.

Decisions

  • Four thematic blocks: Volume, Performance, Satisfaction and Coverage, Distribution. Managers read top to bottom, from general to specific.
  • Period filter (All, 7, 30, 60 and 90 days) and export to XLS and PDF.
  • Resolution metrics: resolution rate, average time, critical tickets and hours worked.
  • Average satisfaction with a call to action (“ask for feedback when closing tickets”), paving the way for score or star ratings.
  • Distribution by priority, status and module, with bar charts and colours consistent with the rest of the system.
  • Empty states that teach (“the proportion chart returns when there are more categories”) instead of broken screens.

Heatmap: Hotjar

I built the heatmap on top of the real dashboard screenshot, with three Hotjar-style views: Clicks (numbered pins and % of clicks), Movement and Attention (how much of the screen is seen, top to bottom).

Client dashboard · SigrAI Helpdesk

Heatmap · Desktop · 1,248 sessions · last 30 days

Dashboard screen123456789
Less
More
  1. 1New ticket18%
  2. 2First ticket in the list22%
  3. 3Tickets 2 to 412%
  4. 4Tickets menu14%
  5. 5“Unassigned” card (includes repeated clicks)9%
  6. 6My tickets / Resolved tabs8%
  7. 7See all6%
  8. 8Get in touch4%
  9. 9Direct contact2%

What the map shows

  • Clicks: Heat concentrates on “New ticket” (18%), the first ticket in the list (22%) and the “Tickets” side menu (14%). Tickets 2 to 4 cool down fast (12% combined).
  • Clicks on the “Unassigned” card: This card (9%) gets repeated clicks, even though it doesn't look like a button.
  • Movement: The mouse follows an F-pattern: across the title, the KPI row and down the left column of the list.
  • Cold zones: The end of the tickets card (empty), the whole right column below “Direct contact”, “Reports” and “Request a demo”.

Hypotheses and suggestions

The KPI cards look clickable, but probably aren't.

Hypothesis: the client clicks “Unassigned: 20” or “Open: 2” expecting a filtered list.

Suggestion: turn each KPI into a shortcut to a pre-filtered Tickets view. First, confirm with session recordings that repeated clicks are really frustrated attempts.

“Unassigned: 20” draws attention for an odd reason.

To the client, 20 tickets “awaiting service” looks like a serious problem, and they react to it.

If that number isn't relevant to them, hide the card in the client view or rename it to something like “Awaiting service”.

The “Tickets” menu competes with the dashboard's “Tickets” card.

Many clicks on the side menu suggest the dashboard list doesn't solve the main task.

Suggestion: measure click rate on “See all” against the menu. If the menu wins, the button is hard to see or the card isn't useful enough.

The list has little differentiation, and test data gets in the way.

All 4 items share the title “[E2E-TESTE]…”; only the High/Medium tag changes.

That loses the client on items 2 to 4. In production, show status, date and assignee on each row and sort by priority and age.

Test tickets also pollute the KPIs and any analysis. Filter them out before running real Hotjar.

The “My tickets” tab gets more interest than “Recent”.

The client may only want to see what they opened. Consider making it the default for users with active tickets.

The right column and the “Talk to Support” block are cold.

The client is already inside the helpdesk, so “Get in touch” (4%) and “Request a demo” (2%) have little appeal. The latter is a sales CTA for existing clients.

Suggestion: use the space for useful content, like tickets with deadlines, related help articles or SLA status.

The empty space at the end of the card suggests poorly distributed density.

Attention drops to ~54% on the last row, and the card has slack nobody sees. There's room for more items or pagination.

Learnings

Colour is content

A simple red turned normal steps into “errors” in users’ minds. Revisiting colour use was one of the cheapest and most impactful changes.

AI transparency builds trust

Showing what the agent does, and when a human takes over, reduced the black-box feeling.

Empty states are design too

Messages like “few tickets, good sign” make an empty screen informative and friendly.

Few users, lots of learning

Two tests were enough to find structural problems, but measuring impact requires a second round.

Thanks for reading this far!

linkedin.com/in/kadumacedo

More projects